Home

Liquid-cooled charging cable

  • Why High-Power CCS2 Sites Move to Liquid-Cooled Connectors Why High-Power CCS2 Sites Move to Liquid-Cooled Connectors
    Sep 22, 2025
    High current changes everything. Once a CCS2 site aims beyond the mid-300-amp range for long stretches, heat, cable weight, and driver ergonomics become the real constraints. Liquid-cooled connectors move heat out of the contact and cable core so the handle stays usable and power stays up. This guide explains when the switch makes sense, what to look for in the hardware, and how to run it with low downtime.     What really breaks at high current– I²R loss drives temperature at contacts and along the conductor.– Thicker copper reduces resistance but makes the cable heavy and stiff.– Ambient heat and back-to-back sessions stack; afternoon queues push shells past limits.– When the connector overheats, the controller derates; sessions stretch and bays back up.     Where natural cooling still winsNaturally cooled handles work well for moderate power and cooler climates. They avoid pumps and coolant. Service is simpler and spares are cheaper. The trade-off is sustained current in hot seasons or under heavy duty.     How liquid cooling solves the problemA liquid-cooled CCS2 connector routes coolant close to the contact set and through the cable core. Heat leaves the copper, not the driver’s hand. Typical assemblies add temperature sensing on power pins and in the cable, plus flow/pressure monitoring and leak detection tied to safe shutdown.     Decision matrix: when to move to liquid-cooled CCS2 Target current (continuous) Typical use case Cable handling & ergonomics Thermal margin across the day Cooling choice ≤250 A Urban fast chargers, low dwell Light, easy High in most climates Natural 250–350 A Mixed traffic, moderate turnover Manageable but thicker Medium; watch hot seasons Natural or Liquid (depends on climate/duty) 350–450 A Highway hubs, long dwell, hot summers Heavy if natural; fatigue rises Low without cooling; early derating Liquid-cooled ≥500 A Flagship bays, fleet lanes, peak events Needs slim, flexible cable Requires active heat removal Liquid-cooled     Workersbee CCS2 liquid-cooled at a glance– Current classes: 300 A / 400 A / 500 A continuous, up to 1000 V DC.– Temperature rise target: < 50 K at the terminal under stated test conditions.– Cooling loop: typical 1.5–3.0 L/min flow at about 3.5–8 bar; around 2.5 L coolant for a 5 m cable.– Heat extraction reference: about 170 W @300 A, 255 W @400 A, 374 W @500 A (published data supports engineering of higher-amp scenarios).– Environmental: IP55 sealing; operating range −30 °C to +50 °C; acoustic output at the handle under 60 dB.– Mechanics: mating force under 100 N; mechanism tested for more than 10,000 cycles.– Materials: silver-plated copper terminals; durable thermoplastic housings and TPU cable.– Compliance: designed for CCS2 EVSE systems and IEC 62196-3 requirements; TÜV/CE.– Warranty: 24 months; OEM/ODM options and common cable lengths available.     Why drivers and operators feel the difference– Slimmer outer diameter and lower bend resistance improve reach to ports on SUVs, vans, and trucks.– Cooler shell temperatures reduce re-plugs and failed starts.– Extra thermal headroom keeps set power flatter during afternoon peaks.   Reliability and service, kept simpleLiquid cooling adds pumps, seals, and sensors, but design choices keep downtime low. Workersbee focuses on field-swappable wear parts (seals, trigger modules, protective boots), accessible temperature and coolant sensors, clear leak-before-break paths, and documented torque steps. Techs can work quickly without pulling the whole harness. A two-year warranty and >10k mating-cycle design align with public-site duty.     Commissioning notes for high-power bays Commission the hottest bay first. Map contact and cable-core sensors; calibrate offsets. Stage holds at 200 A, 300 A, and target current; record ΔT from ambient to handle shell. Set current-versus-coolant curves and boost windows in the controller; enable graceful taper. Monitor three numbers: contact temperature, cable inlet temperature, and flow. Alert policy: “yellow” for drift (rising ΔT at the same current), “red” for no-flow, leak, or over-temp. On-site kit: pre-filled coolant pack, O-rings, trigger module, sensor pair, torque sheet. Weekly review: plot power hold time vs ambient; rotate bays if one lane heats earliest.     Buyer scorecard for CCS2 liquid-cooled connectors Attribute Why it matters What good looks like Continuous current rating Drives session time Holds target amps for an hour in hot weather Boost behavior Peaks need control and recovery Stated boost time plus auto-recovery window Cable diameter & mass Ergonomics and reach Slim, flexible, true one-hand plug-in Temperature sensing Protects contacts and plastics Sensors on pins and in cable core Coolant monitoring Safety and uptime Flow + pressure + leak detect + interlocks Serviceability Mean time to repair Swap seals, triggers, and sensors in minutes Environmental sealing Weather and washdowns IP55 class with tested drain paths Documentation Field speed and repeatability Illustrated torque steps and spares list     Thermal reality checkTwo conditions stress even good hardware: high ambient temperature and high duty cycle. Without liquid cooling, the controller must derate earlier to protect contacts. Using a liquid-cooled CCS2 handle lets the site sustain target current for longer, trimming queues and stabilizing per-bay revenue.   
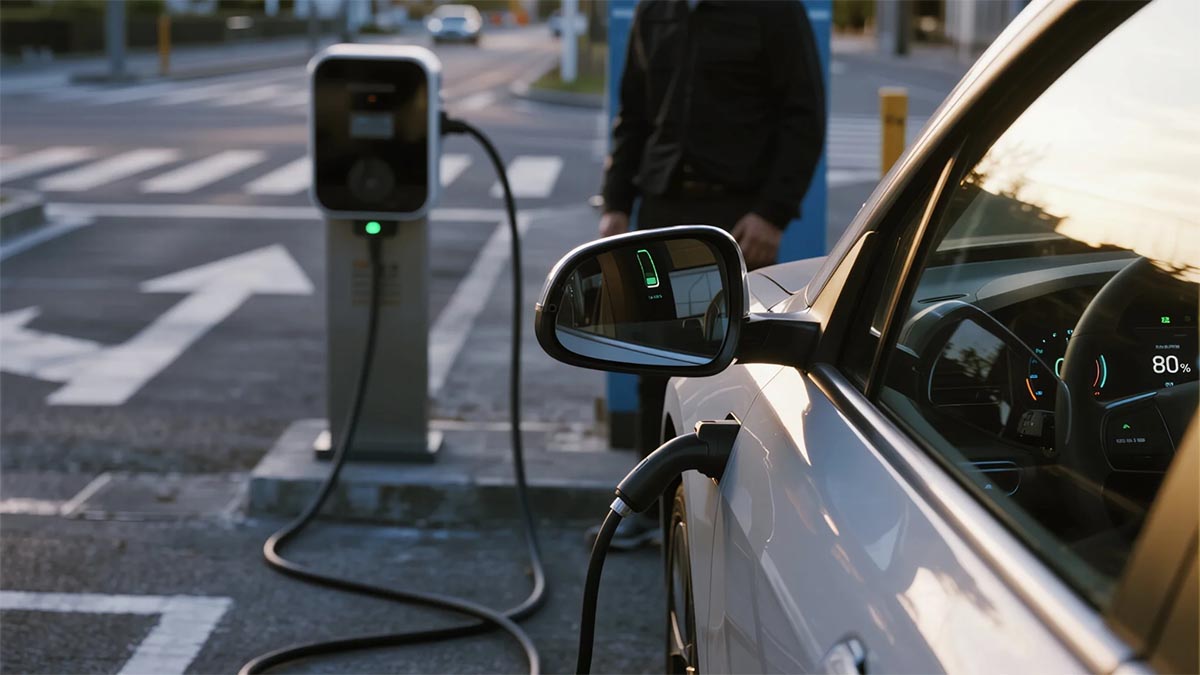
Human factorsDrivers judge a site by how quickly they can plug in and walk away. A stiff cable or hot shell slows them down and raises error rates. Slim, liquid-cooled cables make ports easier to reach and allow a natural, comfortable plug-in angle.   Compatibility and standardsThe CCS2 signaling stays the same; what changes is the heat path and the monitoring. Build acceptance around temperature rise, shell temperature, and fault handling. Keep per-bay records of current, ambient, contact temperature, and taper points to support audits and seasonal tuning.   Cost of ownership, not just CapExFrequent derating costs more in longer sessions and walk-offs than it saves on hardware. Factor session time at your top ambient bins, tech time for common swaps, consumables (coolant, filters if used), and unplanned downtime hours per quarter. For high-duty hubs, liquid-cooled connectors win on throughput and predictability.     Where Workersbee fits Workersbee’s liquid-cooled CCS2 handle is built for steady high current and easy upkeep, with field-accessible sensors, quick-swap seals, a quiet grip, and clear torque steps for technicians. Integration notes cover flow (1.5–3.0 L/min), pressure (about 3.5–8 bar), power draw under 160 W for the cooling loop, and typical coolant volume per cable length. This helps sites bring flagship bays online quickly and hold power in hot seasons without moving to bulky cables.     FAQ At what current should I consider liquid cooling?When your plan calls for sustained current in the upper-300-amp range or higher, or when your climate and duty cycle push shell temperatures up. Is liquid cooling hard to maintain?It adds parts, but good designs make the usual swaps quick. Keep a small kit on site and log thresholds. Will drivers notice the difference?Yes. Slimmer cables and cooler handles make plug-ins faster and reduce mis-starts. Can I mix bays?Yes. Many sites run a few liquid-cooled lanes for heavy traffic and keep naturally cooled lanes for moderate demand.
    Read More
  • Why EV Charging Slows After 80% Why EV Charging Slows After 80%
    Sep 15, 2025
    The short answerCharging slows after roughly 80 percent because the car protects the battery. As cells fill up, the BMS shifts from constant current to constant voltage and trims the current. Power tapers, and each extra percent takes longer. This is normal behavior.   Related articles: How to Improve EV Charging Speed (2025 Guide)     Why the taper happens Voltage headroomNear full, cell voltage approaches safe limits. The BMS eases current so no cell overshoots. Heat and safetyHigh current makes heat in the pack, cable, and contacts. With less thermal margin near full, the system reduces power. Cell balancingPacks have many cells. Small differences grow near 100 percent. The BMS slows down so weaker cells can catch up.     What drivers can do to save time• Set the fast charger in the car’s navigation to trigger preconditioning.• Arrive low, leave early. Reach the site around 10–30 percent, charge to the range you need, often 70–80 percent.• Avoid paired or busy stalls if the site shares cabinet power.• Check the handle and cable. If they look damaged or feel very hot, switch stalls.• If a session ramps poorly, stop and start on another stall.   When going past 80 percent makes sense• Long gap to the next charger.• Very cold night and you want a buffer.• Towing or long climbs ahead.• The next site is limited or often full.     How sites influence the last 20 percent• Power allocation. Dynamic sharing lets an active stall take full output.• Thermal design. Shade, airflow, and clean filters help stalls hold power in summer.• Firmware and logs. Current software and trend checks prevent early derates.• Maintenance. Clean pins, healthy seals, and good strain relief lower contact resistance.     Tech note — Workersbee On high-use DC lanes, the connector and cable decide how long you can stay near peak. Workersbee’s liquid-cooled CCS2 handle routes heat away from the contacts and places temperature and pressure sensors where a technician can read them fast. Field-replaceable seals and clear torque steps make swaps quick. The result is fewer early trims during hot, busy hours.     Quick diagnostic flow Step 1 — Car• SoC already high (≥80 percent)? Taper is expected.• Battery cold or hot message? Precondition or cool, then retry. Step 2 — Stall• Paired stall with a neighbor active? Move to a non-paired or idle stall.• Handle or cable very hot, or visibly worn? Switch stalls and report it. Step 3 — Site• Hub packed and lights cycling? Expect reduced rates or route to the next site.     80%+ behavior and what to do Symptom at 80–100% Likely cause Quick move What to expect Sharp drop near ~80% CC→CV transition; balancing Stop at 75–85% if time matters Quicker trips with two short stops Hot day, early trims Thermal limits in cable/charger Try shaded or idle stall More stable power Two cars share one cabinet Power sharing Pick a non-paired stall Higher and steadier kW Slow start, then taper No preconditioning Set charger in nav; drive a bit longer before stop Higher initial kW next try Good start, repeated dips Contact or cable issue Change stalls; report handle Normal curve returns      FAQ Q1: Is slow charging after 80% a charger fault?A: Usually not. The car’s BMS tapers current near full to protect the battery. That said, you can rule out a bad stall in under two minutes:• If you’re already above ~80%, a falling power line is expected—move on when you have enough range.• If you’re well below ~80% and power is abnormally low, try an idle, non-paired stall. If the new stall is much faster, the first one likely had sharing or wear issues.• Visible damage, very hot handles, or repeated session drops point to a hardware problem—switch stalls and report it.   Q2: When should I charge past 90%?A: When the next stretch demands it. Use this simple check:• Look at your nav’s energy-at-arrival for the next charger or your destination.• If the estimate is under ~15–20% buffer (bad weather, hills, night driving, or towing), keep charging past 80%.• Sparse networks, winter nights, long climbs, and towing are the common cases where 90–100% saves stress.   Q3: Why do two cars on one cabinet both slow down?A: Many sites split one power module between two posts (paired stalls). When both are active, each gets a slice, so both see lower kW. How to spot it and fix it:• Look for paired labels (A/B or 1/2) on the same cabinet, or for signage explaining sharing.• If your neighbor plugs in and your power falls, you’re likely sharing. Move to a non-paired or idle post.• Some hubs have independent cabinets per post; in those cases, pairing isn’t the cause—check temperature or the stall’s condition instead.   Q4: Do cables and connectors really change my speed?A: They don’t raise your car’s peak, but they decide how long you can stay near it. Heat and contact resistance trigger early derates. What to watch:• Signs of trouble: a handle that’s very hot to the touch, scuffed pins, torn seals, or a cable that kinks sharply.• Quick fixes for drivers: pick a shaded or idle stall, avoid tight bends, and switch posts if the handle feels overheated.• Site practices that help everyone: keep filters clear and air moving, clean contacts, replace worn seals, and use liquid-cooled cables on high-traffic, high-power lanes to hold current longer.
    Read More
  • How to Improve EV Charging Speed (2025 Guide) How to Improve EV Charging Speed (2025 Guide)
    Sep 10, 2025
    Glossary • SoC: battery state of charge, shown as a percentage.• Charge curve: how power rises, peaks, then tapers as SoC increases.• Preconditioning: the car warms or cools the battery before a fast charge so it’s at the right temperature.• Peak power: the maximum kW your car can draw, usually only for a short burst.• Power sharing: a site splits power between stalls when many cars plug in.• BMS: the car’s battery management system that keeps the pack safe and sets charging limits.     Why is the same car fast today and slow tomorrowThree scenes explain most slow sessions. 1. Cold morning. You may arrive with the cabin toasty but the battery still cold, and the car will reduce charging power to protect the cells.   2. Hot afternoon. Cable and electronics run hot. The system reduces power to hold safe temperature.   3. Busy site. Two or more stalls pull from the same cabinet. Each car gets a slice, so your power drops.     The charge curve explained Fast at low SoC, slower near full. Most cars charge quickest below roughly 50–60 percent, then taper as they pass 70–80 percent. The last 10–20 percent is the slowest part. If you need to save time, plan for short stops in the fast zone instead of one long session to near 100 percent.       What drivers can control in minutes• Navigate to the fast charger in your car’s system before you set off. This triggers battery preconditioning on many models.• Arrive low, leave smart. Reach the site around 10–30 percent, charge to the range you need, often 70–80 percent, then go.• Pick the right stall. If cabinets are labeled A–B or 1–2, choose a stall that is not paired or not in use.• Check the handle and cable. Avoid damaged connectors, tight kinks, or hot-to-the-touch cables.• Avoid back-to-back heat. If your car or the cable feels hot after a long drive, a five-minute cool-off with the car in Park can help the next ramp.     What site owners can control• Available power. Size cabinets and grid feed for peak times, not only averages.• Power allocation. Use dynamic sharing so a single active stall gets the full output.• Thermal design. Keep inlets, filters, and cable routing clear; add shade or airflow in hot climates.• Firmware and logs. Keep charger and CSMS software up to date; watch for stalls that derate early.• Maintenance. Inspect pins, seals, strain relief, and contact resistance; swap worn parts before they cause drop-offs.     Quick diagnostic path when charge is slower than expectedStep 1 — Check the car:• SoC above 80 percent → taper is normal; stop early if time matters.• Battery too cold or too hot warning → start preconditioning, move the car into shade or out of wind, retry. Step 2 — Check the stall:• Paired stall light is active or neighbor is charging → move to an unpaired or idle stall.• Cable or handle feels very hot, or visible damage → switch to another stall and report it. Step 3 — Check the site:• Many cars waiting, site at capacity → accept a reduced rate or route to the next hub on your path.     Action plan scorecard Situation Quick move Why it helps Typical result Arrive with high SoC Stop sooner; plan two short stops Stays in the fast zone of the curve More kWh per minute overall Cold battery in winter Precondition via car navigation Brings cells into the optimal window Higher initial kW Hot cable or stall Change to a shaded or idle stall Lowers thermal stress on hardware Less thermal derate Paired stalls are busy Pick an unpaired cabinet output Avoids power sharing More stable power Unknown slow-down cause Unplug, replug after 60 seconds Resets session and handshake Recover lost ramp     Cold and hot weather tipsWinter: Start preconditioning 15–30 minutes before arrival. Park out of strong wind while waiting. If you do short hops between chargers, the pack may never warm up; plan one longer drive before your fast stop.Summer: Shade matters. Canopies reduce heat on chargers and cables. If you tow or climb hills before charging, give the car a short cool-off with HVAC on but drive unit at rest.     How connectors and cables affect your speed windowThe charger cabinet sets the ceiling, and your car sets the rules, but the connector and cable decide how long you can stay near peak power. Lower contact resistance, clear heat paths, and good strain relief help the system hold current without early derating. In high-traffic sites, liquid-cooled DC cables widen the usable high-power window, while naturally cooled assemblies work well at moderate currents with simpler upkeep. Workersbee focus: Workersbee liquid-cooled CCS2 connector uses a tightly managed thermal path and accessible sensor layout to help sites hold higher current longer, with field-serviceable seals and defined torque steps for quick swaps.     Operations playbook for site owners• Design for the dwell you promise. If you market 10–80 percent in under 25–30 minutes for typical cars, size your cabinets and cooling for warm days and shared use. • Map cabinet-to-stall pairing in your signage. Drivers should know which stalls share a module. • Add human factors. Cable length, reach angles, and parking geometry change how easily drivers plug and route the cable. Shorter, slimmer cables reduce mishandling and damage. • Build a five-minute inspection. Look for pitted pins, loose latches, torn boots, and hot spots on thermal cameras during peak hours. Log any stall that tapers too early. • Keep spares ready. Stock handles, seals, and strain relief kits so a tech can restore full speed in one visit.     Common myths, clarifiedMyth: A 350 kW charger is always faster than a 150 kW unit.Reality: It depends on your car’s max accept rate and where you are on the charge curve. Many cars never draw 350 kW except for a short spike.   Myth: If power drops after 80 percent, the charger is faulty.Reality: Taper near full is normal and protects the battery. Stop early if you are in a hurry.   Myth: Cold weather always means slow charging.Reality: Cold plus no preconditioning is slow. With preconditioning and a longer drive before your stop, many cars can still charge briskly.     Driver checklist•  Set the fast charger as your destination in the car’s navigation so preconditioning starts automatically.• Arrive low, leave around 70–80 percent if time is key.• Choose an idle, non-paired stall.• Avoid damaged or overheated cables.• If speed is poor, unplug and retry on another stall.     Light maintenance cues for attendants• Clean and check the connector’s pins and seals every day.• Keep cables off the ground and avoid tight bends along the run.• Note stalls that show early derate or frequent retries; schedule a deeper check.• Review logs weekly for temperature alarms and handshake errors.     What this means for fleets and high-use sitesFleets live on predictable turn-times. Standardize driver behavior, keep the fastest stalls clearly signed, and protect thermal performance with shade and airflow. If you operate mixed hardware, tag which stalls hold current longest during summer peaks and route queuing there first. Workersbee can help by matching connector and cable sets to your cabinet ratings and climate. Workersbee naturally cooled and liquid-cooled assemblies are built for repeatable handling and quick field service, which supports consistent dwell times during busy hours.     Key takeaways• Charging speed follows a curve, not a single fixed number. Use the fast zone and avoid the slow tail.• Temperature and sharing are the two biggest hidden factors.• Small habits make big differences: precondition, arrive low, pick the right stall.• For sites, thermal design and upkeep keep high current alive longer.
    Read More
  • Megawatt Charging System (MCS) Guide for Heavy-Duty EVs: Power, Cooling, and Site Planning Megawatt Charging System (MCS) Guide for Heavy-Duty EVs: Power, Cooling, and Site Planning
    Sep 01, 2025
    Megawatt Charging System (MCS) is an emerging DC fast-charging approach for heavy-duty electric vehicles with high daily energy demand. It targets a high-voltage, high-current operating window and uses liquid-cooled hardware to manage heat at megawatt duty cycles. This lets a single stop deliver meaningful energy without turning routes into charging schedules. The goal is simple: turn a regulated rest break or a depot turnaround into real “refueling” time for trucks and coaches.   This page is a practical hub for MCS decisions. It covers session math, connector and cable cooling, fleet-focused control and logging, interoperability assumptions, and site sizing logic. It also includes a rollout checklist to align vehicles, EVSE, connector assemblies, and operations before pilots scale.     On this page · What MCS is and what it is not · Why fleets care · How an MCS session works · Power and energy per stop · Cooling and temperature limits · Control, logging, and uptime · Standards and interoperability · Where MCS will show up first · MCS vs passenger-car DC fast charging · Pitfalls in early pilots · Sizing an MCS site · Storage and peak management · Serviceability, uptime, and safety · Procurement and rollout checklist · FAQ · Connector and cable hardware considerations     What MCS is and what it is not MCS is a high-power DC charging architecture designed for heavy-duty EVs such as long-haul trucks, tractors, intercity coaches, and other high-utilization commercial vehicles. Industry roadmaps often discuss a voltage window reaching roughly the 1 kV class (with some references up to about 1,250 V) and current capability in the multi-kiloamp range (figures around 3,000 A are commonly cited). Actual delivered power and sustained current depend on the vehicle charge curve, cable thermal design, ambient conditions, and the derating strategy used to keep contacts and accessible surfaces within safe limits.   MCS is not “a bigger car charger.” Passenger-car DC fast charging is often occasional and opportunistic. MCS is engineered for repeatable, high-energy sessions where downtime is expensive and schedules are tight. That duty cycle changes decisions around cables, cooling, wear parts, commissioning, and service workflow.     Why fleets care Heavy-duty operations already have charging windows. Drivers have mandated breaks, coaches have fixed dwell times, and depot fleets run predictable shift cycles. The challenge is energy: vehicles need enough kWh per stop to keep routes intact.   MCS targets those windows. If a stop can consistently deliver hundreds of kWh, fleets can reduce extra charging stops, avoid unnecessary battery oversizing, and keep schedules stable. Charging becomes part of the operating plan, not an exception.     How an MCS session works A stable MCS session is more than “plug in and push power.” The sequence below is useful for commissioning and for diagnosing field failures. It also clarifies which events should be logged on both the vehicle and EVSE side. 1. Vehicle arrives and is positioned at the bay. 2. Coupler mates with the vehicle inlet. 3. Safety and insulation checks complete. 4. Authorization and authentication succeed. 5. Vehicle and EVSE negotiate voltage and current limits. 6. Thermal supervision is enabled (contacts, cable, and key hotspots). 7. Power ramps up to the negotiated limit. 8. Steady-state delivery continues with dynamic derating as needed. 9. Power ramps down in a controlled way; metering and logs are finalized. 10. Unlatch/unmate; session record syncs to backend systems.   For early projects, define a minimum logging set from day one: negotiated voltage/current limits, ramp behavior, temperature snapshots, fault codes on both sides, and the session end cause. Without this, intermittent failures are hard to triage.     Power and energy per stop Two numbers matter at first pass: peak power and delivered energy per stop. Power is voltage multiplied by current. Energy is power multiplied by time, minus losses and battery acceptance limits.   A quick reality check: · A 1,000 kW session over 30 minutes is about 500 kWh gross from the charger (1 MW × 0.5 h = 0.5 MWh). · What reaches the battery depends on the vehicle’s charge curve and system losses. · Sustained power matters more than a brief peak for route planning.   A practical planning model uses three multipliers: session gross energy (charger output), end-to-end efficiency (charger + cable + vehicle), and usable window (how long the vehicle can stay near high power). Even rough estimates are valuable because they show scale and constraints.   Cooling and temperature limits At megawatt duty cycles, the cable assembly becomes a system, not a commodity. High current increases resistive heating and raises surface temperature risk for drivers. For hand-handled couplers at multi-kiloamp currents, liquid cooling is the practical mainstream approach to control temperature and cable mass, especially under repeated duty cycles.   A durable design usually combines the items below, and treats them as operational requirements rather than optional features: · Liquid-cooled conductors to limit temperature rise without making the cable unmanageable. · Temperature supervision near heat sources (contacts and high-current paths). · A graceful derating strategy that protects safety while keeping sessions useful.   Ergonomics is not cosmetic in MCS. Gloves, rain, dust, night work, and time pressure are normal. Handling affects both safety and throughput.   Control, logging, and uptime In commercial operations, control and data are part of the charging system. Reliability depends on predictable session start behavior, robust fault handling, and logs that let teams diagnose issues quickly.   Key capabilities to plan for: · Smooth session start (readiness checks and consistent start conditions). · Power negotiation across the operating window, including ramps and limits. · Metering and reporting aligned with fleet workflows. · Fault logging that can be correlated between vehicle and EVSE. · Remote diagnostics and secure update paths to reduce truck rolls.   These items directly affect availability metrics. When control is fragile, fleets see sessions that fail to start, stop mid-session, or behave inconsistently across vehicles. That becomes lost route capacity, not a minor inconvenience.   Standards and interoperability MCS is defined as an ecosystem rather than a single component. Teams get the most value by separating what is stable enough for pilots from what will evolve as more field data accumulates.   A procurement stance that reduces risk: · Specify interoperability test scope (vehicles, EVSE, operating conditions). · Define firmware update expectations and responsibility boundaries. · Require shared fault log formats so field issues can be triaged quickly.   Early deployments should assume commissioning retests and software tuning are normal. Plan for them explicitly in schedules and acceptance criteria.   Where MCS will show up first MCS adoption is strongest where energy demand per vehicle is high and downtime is costly. Early sites typically focus on: · Freight corridors where each stop must add substantial route recovery. · Intercity coach hubs with fast turnarounds and reserved stands. · Ports and logistics terminals with repeated daily cycles. · Mines and construction environments with long shifts and limited windows. · High-utilization depot operations that need predictable throughput.     MCS vs passenger-car DC fast charging A cabinet and a cable can look similar on the outside. Under the hood, the design constraints are different. The table below summarizes the practical differences that show up in deployments.   Aspect Passenger-car DC fast charging Megawatt Charging System (MCS) Typical vehicle Cars and light vans Trucks, tractors, buses, specialty heavy EVs Typical power ~50–350 kW ~750 kW to 1 MW+ (depends on system limits) Duty cycle Occasional, opportunistic Daily, high-energy, repeatable Stop pattern Driver-chosen, irregular Tied to schedules, breaks, depot flow Cable strategy Air-cooled or modest cooling Liquid-cooled high-current assemblies (mainstream) Handling Light cable, small handle Heavier system, ergonomics engineered Service model General station maintenance Wear-aware parts strategy, faster swaps Uptime impact Inconvenience Direct operational loss (routes, depots, commitments)   The consequence is that MCS sites should be treated like industrial assets. Cable management, spare parts, technician access, and fault workflow matter as much as nameplate power.   Pitfalls in early pilots These issues show up repeatedly in pilots and can derail timelines if they are not addressed early: 11. Chasing peak power instead of repeatable throughput. 12. Underestimating cable handling and serviceability. 13. Treating cooling as an accessory instead of an operational system. 14. Pushing interoperability testing too late in the project. 15. Missing shared fault logging across vehicle and EVSE. 16. Using site power assumptions that ignore simultaneity and ramp behavior. 17. No credible plan for growth beyond the first site.   Sizing an MCS site Site planning starts with honest assumptions: how many vehicles will charge concurrently, typical session length, arrival SOC distribution, and how power will be allocated across bays. The objective is to size for operational reality, then validate with measured data.   Example: a four-bay MCS site (illustrative only) Assume four dispensers each rated at 1 MW. If operations rarely hold all bays at peak simultaneously, a diversified peak can be lower than nameplate. A placeholder simultaneity factor (for example, 0.6 as an illustration) would imply ~2.4 MW diversified peak for a 4 MW nameplate site. Transformer sizing and grid interconnection must follow local utility requirements, detailed load studies, and the site’s demand-charge structure.   Topology choices that improve utilization · Shared DC architectures can route power across bays. · Power allocation logic can prioritize vehicles with earlier departures. · Modular cabinets can reduce rework as utilization grows.   Storage and peak management On-site storage can shave short overlaps, support brief disturbances, and help a smaller grid connection feed higher short-duration delivery. Even without storage, power management can coordinate ramps, reduce unnecessary peaks, and align charging priority with operational urgency.   Treat peak management as a design input. If it is bolted on later, peak costs and underutilization tend to become permanent.   Serviceability, uptime, and safety Megawatt sites often fail in small ways before they fail in big ways. Physical details decide whether uptime is steady or painful.   Design for field service from day one: · Protect cooling lines and cable paths from impact and vehicle traffic. · Ensure technician access to pumps, filters, and heat exchangers. · Match ingress protection to dust, moisture, and road-grime conditions. · Provide ventilation and, where needed, enclosure thermal management. · Plan drainage and cleaning in real depot conditions.   Safety behavior at high power typically depends on layered protection. Commissioning should test rushed coupling, poor weather, and partial failures, not only ideal lab conditions. · Isolation and lockout strategies. · Insulation/leakage monitoring. · Emergency-stop coverage across dispensers and cabinets. · Controlled management of abnormal conditions. · Temperature supervision and safe derating behavior. · Ergonomic placement so manual coupling remains practical under pressure.     Procurement and rollout checklist This checklist is designed to prevent pilot surprises by forcing alignment across vehicles, EVSE, connector assemblies, cooling, software, and operations.   Vehicle compatibility · Inlet location and access with trailer geometry and bay design. · Supported voltage window and maximum current today. · Communication profile and update strategy (vehicle firmware plan).   Power strategy · Dispenser rating today and target rating later. · Power allocation capability across bays. · Expandability without full civil rework.   Cooling and service · Cooling loop service intervals and field procedures. · Fill, purge, and leak-check responsibilities. · Field-replaceable modules and target swap time.   Software and operations · Authentication methods and fleet workflows. · Session reporting and log retention. · Secure update paths and remote diagnostics.   Commissioning and quality checks · Interoperability tests with target vehicles under controlled conditions. · Thermal validation under repeated duty cycles. · Baseline KPIs: utilization, success rate, efficiency, station availability.   A practical rollout method is to treat the first site as a pilot while designing it so the lessons scale to a corridor or regional network.     FAQ How fast is MCS in day-to-day use? Early demos often target meaningful energy delivery in about half an hour, but real results vary by charge curve, temperature, arrival SOC, and the station’s sustained power capability.   Will passenger cars use MCS? MCS is tailored to heavy-vehicle geometry, energy use, and duty cycles. Passenger vehicles are likely to remain on lighter connectors and power levels that match smaller packs and easier handling.   Is liquid cooling necessary? For megawatt-class current through a hand-handled connector, liquid cooling is the practical mainstream approach to keep cable size, weight, and temperature within safe handling limits, especially under repeated duty cycles.   What should buyers assume about interoperability? Expect commissioning retests and software tuning as deployments expand. Define test scope, update expectations, and shared fault logging up front so issues can be triaged quickly.     Connector and cable hardware considerations Connector and cable decisions show up everywhere: thermal limits, driver handling, service workflow, and station uptime. A partner with high-current DC experience can help translate megawatt goals into maintainable assemblies and realistic field behavior. Workersbee develops high-current connector and cable components that map to MCS requirements, especially around liquid-cooled operation and service-friendly cable assemblies through EV charging connectors and MCS connector solutions.   For early deployments, treat the connector and cable assembly as a lifecycle system, not just a line item. The best pilots are built to scale—technically, operationally, and financially.
    Read More

Need Help? leave a message

Leave A Message
Submit

home

products

whatsApp

contact